Multiple Choice
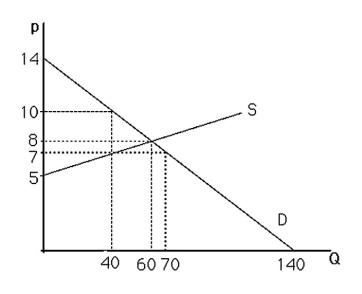
-The above figure shows a graph of the market for pizzas in a large town.What are the equilibrium price and quantity?
A) p = 8,Q = 60
B) p = 60,Q = 8
C) p = 14,Q = 140
D) p = 5,Q = 60
Correct Answer:

Verified
Correct Answer:
Verified
Q42: During the winter of 1997-1998,the northeastern United
Q55: <img src="https://d2lvgg3v3hfg70.cloudfront.net/TB6808/.jpg" alt=" -The above figure
Q69: Equilibrium is defined as a situation in
Q71: Explain why when the demand curve for
Q103: The price for tickets of a sold-out
Q106: Use supply-and-demand graphs to explain why parking
Q108: The demand curve for Widgets is given
Q109: The vertical distance of the shift in
Q128: <img src="https://d2lvgg3v3hfg70.cloudfront.net/TB6808/.jpg" alt=" -The above figure
Q147: Once an equilibrium is achieved,it can persist