menu-iconExamlexExamLexServices

Discover

Ask a Question
  1. All Topics
  2. Topic
    Business
  3. Study Set
    Microeconomics Theory Study Set 1
  4. Exam
    Exam 9: Properties and Applications of the Competitive Model
  5. Question
    -The Above Figure Shows Supply and Demand Curves for Milk
Solved

-The Above Figure Shows Supply and Demand Curves for Milk

Question 52

Question 52

Multiple Choice

  -The above figure shows supply and demand curves for milk.If amount Q<sub>2</sub> is produced in the market, A) producer surplus is maximized. B) consumer surplus is minimized. C) a deadweight loss is generated. D) All of the above.
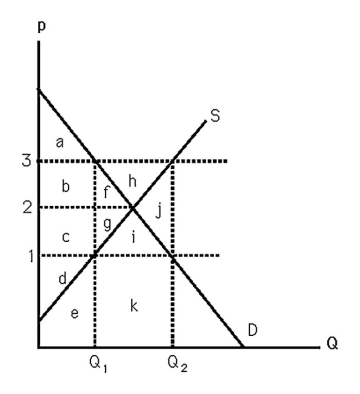
-The above figure shows supply and demand curves for milk.If amount Q2 is produced in the market,


A) producer surplus is maximized.
B) consumer surplus is minimized.
C) a deadweight loss is generated.
D) All of the above.

Correct Answer:

verifed

Verified

Unlock this answer now
Get Access to more Verified Answers free of charge

Related Questions

Q6: Suppose the market supply curve is p

Q8: In the long run,firms in a competitive

Q46: Producer surplus equals<br>A) total revenue minus total

Q53: Competitive firms earn zero profit in the

Q54: <img src="https://d2lvgg3v3hfg70.cloudfront.net/TB3096/.jpg" alt=" -The above figure

Q56: <img src="https://d2lvgg3v3hfg70.cloudfront.net/TB3096/.jpg" alt=" -The above figure

Q72: <img src="https://d2lvgg3v3hfg70.cloudfront.net/TB6808/.jpg" alt=" -The above figure

Q88: If entry is limited due to a

Q107: <img src="https://d2lvgg3v3hfg70.cloudfront.net/TB5322/.jpg" alt=" -The above figure

Q151: Explain why a government would impose an

Examlex

ExamLex

About UsContact UsPerks CenterHomeschoolingTest Prep

Work With Us

Campus RepresentativeInfluencers

Links

FaqPricingChrome Extension

Download The App

Get App StoreGet Google Play

Policies

Privacy PolicyTerms of ServiceHonor CodeCommunity Guidelines

Scan To Download

qr-code

Copyright © (2025) ExamLex LLC.

Privacy PolicyTerms Of ServiceHonor CodeCommunity Guidelines