Essay
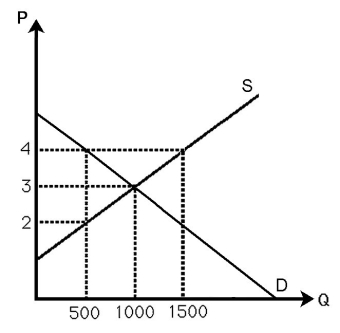
-The above figure shows the demand and supply curves in the market for milk.Currently the market is in equilibrium.If the government imposes a $2 per gallon tax to be collected from sellers,estimate the change in p,Q,and social welfare.
Correct Answer:

Verified
The supply curve shifts vertically by $2...View Answer
Unlock this answer now
Get Access to more Verified Answers free of charge
Correct Answer:
Verified
View Answer
Unlock this answer now
Get Access to more Verified Answers free of charge
Q71: Giving presents at Christmas does NOT generate
Q72: <img src="https://d2lvgg3v3hfg70.cloudfront.net/TB6808/.jpg" alt=" -The above figure
Q73: The services of real estate brokers are
Q74: If a city government enacts a maximum
Q75: In the long run,competitive firms MUST be
Q77: If a firm is in a perfectly
Q78: Does a competitive long-run equilibrium require cost-minimization?<br>A)
Q79: The total welfare associated with a market
Q80: An individual's _ surplus is the area
Q81: <img src="https://d2lvgg3v3hfg70.cloudfront.net/TB6808/.jpg" alt=" -The above figure