Essay
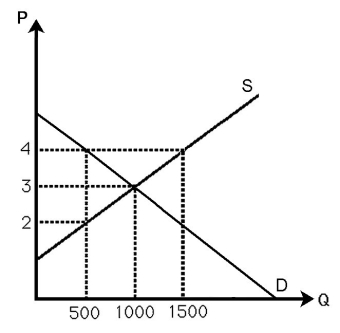
-The above figure shows the demand and supply curves in the market for milk.Currently,the market is in equilibrium.If the government imposes a $2 per gallon tax to be collected from sellers,calculate the dead weight loss associated with the tax,and explain why the dead weight loss occurs.
Correct Answer:

Verified
The deadweight loss equals .5 ∗ 2 ∗ 500 ...View Answer
Unlock this answer now
Get Access to more Verified Answers free of charge
Correct Answer:
Verified
View Answer
Unlock this answer now
Get Access to more Verified Answers free of charge
Q122: A minimum wage is an example of
Q123: Explain why the competitive output maximizes welfare.
Q124: Assume a consumer has a horizontal demand
Q125: A ban on imports,a tariff,or a quota
Q126: <img src="https://d2lvgg3v3hfg70.cloudfront.net/TB6808/.jpg" alt=" -The above figure
Q128: If a city decides to restrict the
Q129: <img src="https://d2lvgg3v3hfg70.cloudfront.net/TB6808/.jpg" alt=" -The domestic demand
Q130: "Supporters of import restrictions and protectionist policies
Q131: <img src="https://d2lvgg3v3hfg70.cloudfront.net/TB6808/.jpg" alt=" -The above figure
Q132: The owners of sports franchises often complain