Multiple Choice
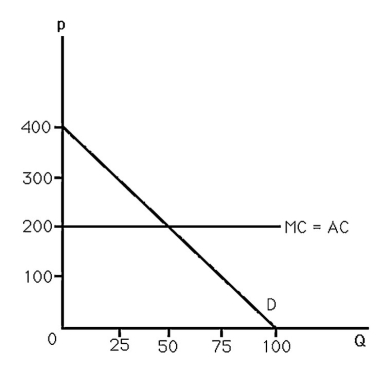
-The above figure shows the demand and cost curves facing a monopoly.The monopoly maximizes profit by setting price equal to
A) $100.
B) $200.
C) $300.
D) $400.
Correct Answer:

Verified
Correct Answer:
Verified
Related Questions
Q23: For the monopsonist,marginal expenditure is greater than
Q26: For a profit maximizing monopolist,if the MC
Q27: The situation in which a person places
Q28: A monopolist faces the (inverse)demand for its
Q30: The "Sonny Bono" Copyright Term Extension Act
Q32: A monopoly incurs a marginal cost of
Q73: <img src="https://d2lvgg3v3hfg70.cloudfront.net/TB6808/.jpg" alt=" -The above figure
Q131: If the inverse demand function for a
Q132: For profit-maximizing monopolies,explain why the boundaries on
Q141: For a monopoly,marginal revenue is less than