menu-iconExamlexExamLexServices

Discover

Ask a Question
  1. All Topics
  2. Topic
    Business
  3. Study Set
    Microeconomics Study Set 3
  4. Exam
    Exam 11: Monopoly
  5. Question
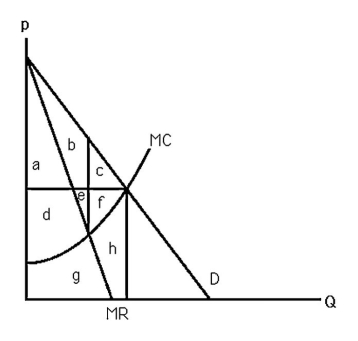
    -The Above Figure Shows the Demand and Marginal Cost Curves
Solved

-The Above Figure Shows the Demand and Marginal Cost Curves

Question 78

Question 78

Multiple Choice

  -The above figure shows the demand and marginal cost curves for a monopoly.Under monopoly,consumer surplus equals A)  a + b. B)  a + b + c. C)  a + b + c + d + e + f. D)  None of the above.
-The above figure shows the demand and marginal cost curves for a monopoly.Under monopoly,consumer surplus equals


A) a + b.
B) a + b + c.
C) a + b + c + d + e + f.
D) None of the above.

Correct Answer:

verifed

Verified

Unlock this answer now
Get Access to more Verified Answers free of charge

Related Questions

Q73: <img src="https://d2lvgg3v3hfg70.cloudfront.net/TB6808/.jpg" alt=" -The above figure

Q74: <img src="https://d2lvgg3v3hfg70.cloudfront.net/TB6808/.jpg" alt=" -The above figure

Q75: A monopoly's output decision depends only on

Q76: If the government desires to raise a

Q77: Humana Hospital's price/marginal cost ratio of 2.3

Q79: If a monopoly's demand curve shifts to

Q80: <img src="https://d2lvgg3v3hfg70.cloudfront.net/TB6808/.jpg" alt=" -The above figure

Q81: The optimal patent length is equal to

Q82: The longer a patent lasts,<br>A) the greater

Q83: Explain Microsoft Windows' monopoly positions in terms

Examlex

ExamLex

About UsContact UsPerks CenterHomeschoolingTest Prep

Work With Us

Campus RepresentativeInfluencers

Links

FaqPricingChrome Extension

Download The App

Get App StoreGet Google Play

Policies

Privacy PolicyTerms of ServiceHonor CodeCommunity Guidelines

Scan To Download

qr-code

Copyright © (2025) ExamLex LLC.

Privacy PolicyTerms Of ServiceHonor CodeCommunity Guidelines