Multiple Choice
Consider the following graph: 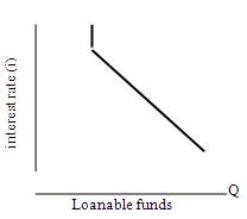 Using the loanable funds approach to interest rate determination,what does the curve in the above graph represent?
A) Household sector supply of loanable funds
B) Business sector demand for loanable funds
C) Overseas sector and household sector supply of loanable funds
D) Government sector and business sector demand for loanable funds
Correct Answer:

Verified
Correct Answer:
Verified
Q88: All of the following will generally make
Q89: The segmented markets theory of term structure:<br>A)
Q90: Under the loanable funds approach to explaining
Q91: It is argued that one of the
Q92: According to expectations theory of term structure,a
Q94: During periods of economic recession,it is probable
Q95: In relation to economic indicators,a leading indicator
Q96: When interest rates increase and normal cash
Q97: The idea that a normal yield curve
Q98: The risk structure of interest rates refers