Multiple Choice
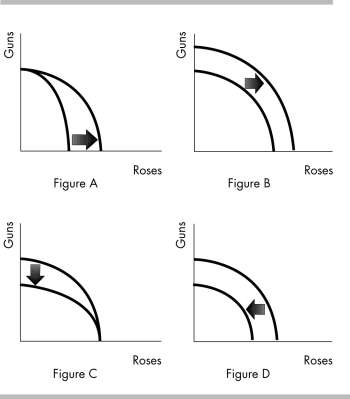
-Which graph shows the impact of scientists developing a more powerful fertilizer?
A) Figure A
B) Figure B
C) Figure C
D) Figure D
Correct Answer:

Verified
Correct Answer:
Verified
Related Questions
Q187: <img src="https://d2lvgg3v3hfg70.cloudfront.net/TB8586/.jpg" alt=" -Employees at Bank
Q188: Any production point outside the production possibilities
Q189: According to the principle of comparative advantage,
Q190: Suppose that when NBC produces 1 new
Q191: Homer and Teddy are stranded on a
Q193: <img src="https://d2lvgg3v3hfg70.cloudfront.net/TB8586/.jpg" alt=" -The table above
Q194: Both Mergatroid and the Geebocks produce only
Q195: In the movie Cast Away, Tom Hanks
Q196: In one day, Brandon can either plow
Q197: While producing on the production possibilities frontier,