Multiple Choice
The table below shows data for the United States.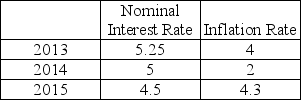
Between 2013 and 2014, the real interest rate ________ and caused a ________ the demand for loanable funds curve.
A) increased; rightward shift
B) decreased; leftward
C) increased; movement upward along
D) decreased; downward along
Correct Answer:

Verified
Correct Answer:
Verified
Q30: <img src="https://d2lvgg3v3hfg70.cloudfront.net/TB8586/.jpg" alt=" -In the above
Q36: If the real interest rate is above
Q48: If a bank's net worth is negative,
Q69: Suppose a firm has an investment project
Q120: According to the Ricardo-Barro effect<br>A) the government
Q130: The funds used to buy and operate
Q133: If the real interest rate rises, people<br>A)
Q134: This year Pizza Hut makes a total
Q189: A decrease in the real interest rate
Q205: National saving equals<br>A) household saving + business