Multiple Choice
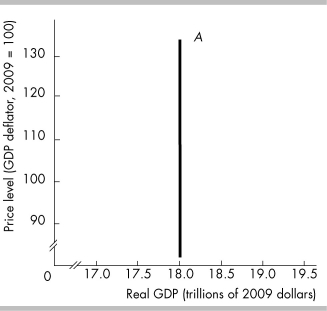
-The curve labeled A in the above figure is a
A) short-run aggregate demand curve.
B) short-run aggregate supply curve.
C) long-run aggregate demand curve.
D) long-run aggregate supply curve.
Correct Answer:

Verified
Correct Answer:
Verified
Q113: A monetarist economist believes that<br>A) if the
Q114: The government increases taxes. As a result,
Q115: <img src="https://d2lvgg3v3hfg70.cloudfront.net/TB8586/.jpg" alt=" -In the above
Q116: Aggregate demand increases if the quantity of
Q117: Which school of thought believes that recessions
Q119: In the short run, an increase in
Q120: <img src="https://d2lvgg3v3hfg70.cloudfront.net/TB8586/.jpg" alt=" -The above figure
Q121: A fall in the money wage rate
Q122: What is the difference between the long-run
Q123: In the short run, firms expand their