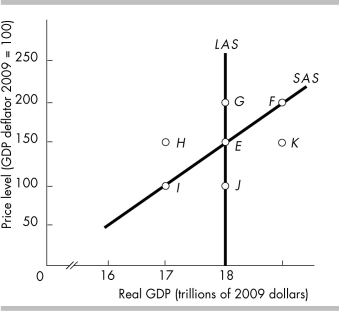
Multiple Choice

-In the above figure, which movement illustrates the impact of a rising price level and a constant money wage rate?
A) E to I
B) E to F
C) E to G
D) E to K
Correct Answer:

Verified
Correct Answer:
Verified
Q140: <img src="https://d2lvgg3v3hfg70.cloudfront.net/TB8586/.jpg" alt=" -Using the data
Q141: A decrease in short-run aggregate supply _
Q142: A rise in the price level changes
Q143: <img src="https://d2lvgg3v3hfg70.cloudfront.net/TB8586/.jpg" alt=" -The data in
Q144: <img src="https://d2lvgg3v3hfg70.cloudfront.net/TB8586/.jpg" alt=" -Based on the
Q146: In the short run, a supply shock
Q147: In the long run<br>A) the aggregate supply
Q148: In the aggregate demand-aggregate supply framework, how
Q149: <img src="https://d2lvgg3v3hfg70.cloudfront.net/TB8586/.jpg" alt=" -The data in
Q150: The land of Mordor increases its capital