Multiple Choice
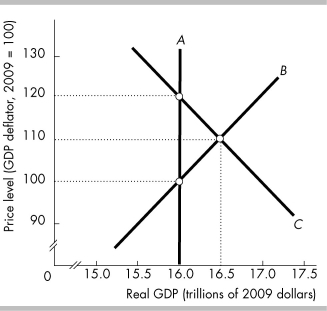
-In the above figure, the short-run macroeconomic equilibrium is at the price level ________ and the real GDP level ________.
A) 110; $16.5 trillion
B) 120; $16 trillion
C) 100; $16 trillion
D) 110; $16 trillion
Correct Answer:

Verified
Correct Answer:
Verified
Q114: The government increases taxes. As a result,
Q127: In the macroeconomic long run<br>A) real GDP
Q204: An increase in the money wage rate<br>A)
Q225: <img src="https://d2lvgg3v3hfg70.cloudfront.net/TB3035/.jpg" alt=" -The figure illustrates
Q231: <img src="https://d2lvgg3v3hfg70.cloudfront.net/TB3035/.jpg" alt=" -In the above
Q246: Aggregate demand is the relationship between the
Q333: In 2008, the Bank of England increased
Q369: <img src="https://d2lvgg3v3hfg70.cloudfront.net/TB8586/.jpg" alt=" -In the above
Q371: If the money wage rate and other
Q384: <img src="https://d2lvgg3v3hfg70.cloudfront.net/TB8586/.jpg" alt=" -The data in