Multiple Choice
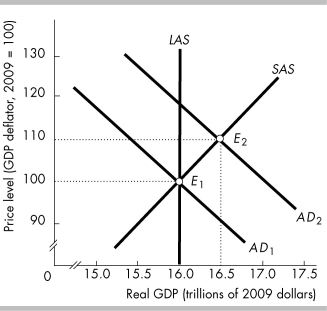
-In the above figure, the inflationary gap when AD? is the aggregate demand curve equals
A) the difference between 110 and 100.
B) the difference between $16.5 trillion and $16.0 trillion.
C) LAS minus SAS at a price level of 100.
D) AD?.
Correct Answer:

Verified
Correct Answer:
Verified
Q35: In November, 2012, U.S. lawmakers were faced
Q58: Moving upward along the short-run aggregate supply
Q109: An above-full-employment equilibrium occurs when<br>A) aggregate demand
Q123: In the short run, firms expand their
Q151: The aggregate demand curve shows the _
Q304: An increase in the money wage rate
Q309: <img src="https://d2lvgg3v3hfg70.cloudfront.net/TB3035/.jpg" alt=" -In the above
Q321: How does the aggregate demand curve reflect
Q323: Long-run macroeconomic equilibrium is achieved when the
Q331: Give examples of factors that decrease short-run