Multiple Choice
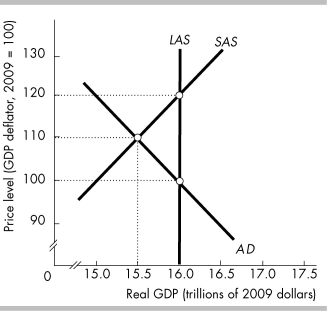
-In the above figure, the short-run equilibrium is at the price level of ________ and real GDP of ________.
A) 100; $15.5 trillion
B) 120; $16 trillion
C) 110; $15.5 trillion
D) 100; $16 trillion
Correct Answer:

Verified
Correct Answer:
Verified
Q8: The U.S. aggregate demand curve shifts leftward
Q66: Substitution effects help explain the slope of
Q83: An individual holds $10,000 in a checking
Q147: In the long run<br>A) the aggregate supply
Q312: Explain the relationship of the long-run aggregate
Q335: A change in the capital stock _
Q350: <img src="https://d2lvgg3v3hfg70.cloudfront.net/TB3035/.jpg" alt=" -In the above
Q353: Other things equal, along the aggregate demand
Q355: <img src="https://d2lvgg3v3hfg70.cloudfront.net/TB8586/.jpg" alt=" -Based on the
Q383: According to the intertemporal substitution effect, when