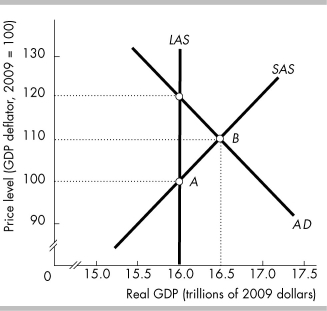
Multiple Choice

-In the above figure, suppose the economy had been at point A and now is at B. What could have led to the movement to B?
A) a tax hike
B) an increase in government expenditures on goods and services
C) Winter storms cause factories in the north to be shut down for several weeks.
D) an increase in the money wage rates
Correct Answer:

Verified
Correct Answer:
Verified
Q18: If higher inflation is expected in the
Q97: <img src="https://d2lvgg3v3hfg70.cloudfront.net/TB8586/.jpg" alt=" -In the above
Q137: <img src="https://d2lvgg3v3hfg70.cloudfront.net/TB8586/.jpg" alt=" -The figure above
Q161: The quantity of real GDP demanded equals
Q162: <img src="https://d2lvgg3v3hfg70.cloudfront.net/TB8586/.jpg" alt=" -In the above
Q171: If the money prices of resources changes,
Q193: Suppose consumers decrease their consumption expenditure because
Q252: The short-run aggregate supply curve<br>A) shows what
Q270: In the short-run, a rise in the
Q392: <img src="https://d2lvgg3v3hfg70.cloudfront.net/TB8586/.jpg" alt=" -In the above