Multiple Choice
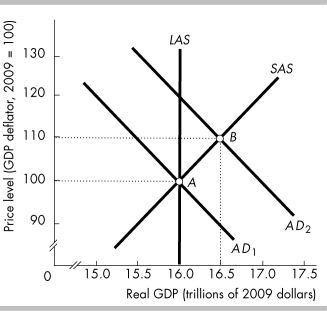
-In the above figure, the aggregate demand curve is AD?, so the long-run equilibrium level of real GDP is
A) $16 trillion.
B) $16.5 trillion.
C) more than $16 and less than $16.5 trillion.
D) None of the above answers is correct.
Correct Answer:

Verified
Correct Answer:
Verified
Q72: In the short-run macroeconomic equilibrium<br>A) real GDP
Q94: An increase in aggregate demand is shown
Q126: If the economy is at long run
Q133: What two variables are determined in an
Q142: A rise in the price level changes
Q155: <img src="https://d2lvgg3v3hfg70.cloudfront.net/TB8586/.jpg" alt=" -The table above
Q173: The AS/AD model studies the relationship between<br>A)
Q215: At long-run macroeconomic equilibrium,<br>A) an inflationary gap
Q273: <img src="https://d2lvgg3v3hfg70.cloudfront.net/TB8586/.jpg" alt=" -In the above
Q348: <img src="https://d2lvgg3v3hfg70.cloudfront.net/TB8586/.jpg" alt=" -In the above