Short Answer
FIGURE 2-2 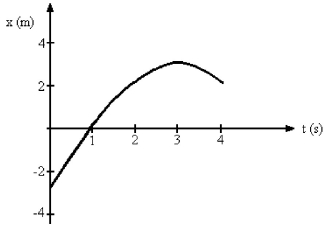
-Figure 2-2 represents the position of a particle as it travels along the x-axis. What is the average speed of the particle between t = 0 s and t = 3 s?
Correct Answer:

Verified
Correct Answer:
Verified
Related Questions
Q4: FIGURE 2-6 <img src="https://d2lvgg3v3hfg70.cloudfront.net/TB6213/.jpg" alt="FIGURE 2-6
Q5: FIGURE 2-3 <img src="https://d2lvgg3v3hfg70.cloudfront.net/TB6213/.jpg" alt="FIGURE 2-3
Q6: A car is traveling at 26.0 m/s
Q7: A car starts from rest and accelerates
Q8: During the time that the acceleration of
Q10: Abby throws a ball straight up and
Q11: An object is thrown upwards with a
Q12: An object is moving with constant non-zero
Q13: Suppose that a car traveling to the
Q14: The position of a particle as a