Multiple Choice
FIGURE 2-10 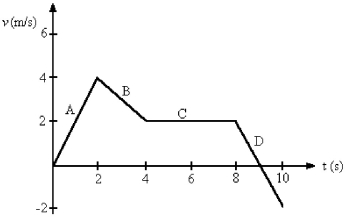
-Figure 2-10 shows the velocity-versus-time graph for a basketball player traveling up and down the court in a straight-line path. Find the total distance run by the player in the 10 s shown in the graph.
A) 20 m
B) 18 m
C) 16 m
D) 14 m
E) 12 m
Correct Answer:

Verified
Correct Answer:
Verified
Related Questions
Q46: The velocity of a particle as a
Q47: An object is moving with constant non-zero
Q48: A stone is thrown straight up. When
Q49: A runner runs around a track consisting
Q50: The slope of a tangent line at
Q52: The slope of a line connecting two
Q53: An object is in free fall as
Q54: To determine the height of a bridge
Q55: Car A is traveling at 22.0 m/s
Q56: FIGURE 2-10 <img src="https://d2lvgg3v3hfg70.cloudfront.net/TB6213/.jpg" alt="FIGURE 2-10