Multiple Choice
FIGURE 7-1 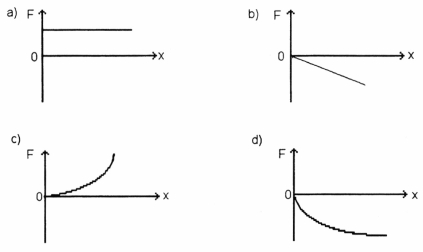
-Which of the graphs in Figure 7-1 illustrates Hooke's Law?
A) graph a
B) graph b
C) graph c
D) graph d
E) none of these
Correct Answer:

Verified
Correct Answer:
Verified
Related Questions
Q5: A student slides her 80.0-kg desk across
Q28: A 5.00-kg box slides 4.00 m across
Q74: The ratio of power outputs of Jack
Q75: A car accelerates from rest to a
Q77: A 4.0 kg mass is moving with
Q80: FIGURE 7-5 <img src="https://d2lvgg3v3hfg70.cloudfront.net/TB6213/.jpg" alt="FIGURE 7-5
Q81: An object of 1.0 kg mass is
Q82: FIGURE 7-4 <img src="https://d2lvgg3v3hfg70.cloudfront.net/TB6213/.jpg" alt="FIGURE 7-4
Q83: A man lifts a 20.0-kg bucket of
Q84: If the net work done on an