Short Answer
FIGURE 30-1 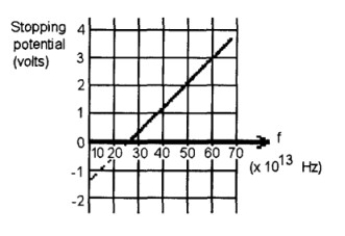
-The graph shown in Figure 30-1 is a plot based on student data from their testing of a
photoelectric material.
(a) Determine the cutoff frequency.
(b) Determine the work function.
Correct Answer:

Verified
(a)25.× 10...View Answer
Unlock this answer now
Get Access to more Verified Answers free of charge
Correct Answer:
Verified
(a)25.× 10...
View Answer
Unlock this answer now
Get Access to more Verified Answers free of charge
Related Questions
Q30: In the spectrum of white light which
Q31: A metallic surface has a work function
Q32: A beam of white light of a
Q33: Which of the following is the correct
Q34: What is the momentum of a photon
Q36: The distribution of energy in the blackbody
Q37: A photon is a particle with positive
Q38: Mathilda collects photoelectric data in her physics
Q39: If the frequency of a photon is
Q40: A photon has an energy of 6.60