Multiple Choice
Figure 1 depicts the: 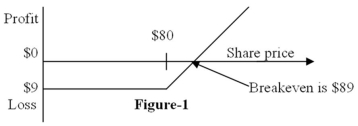
A) position diagram for the buyer of a call option.
B) profit diagram for the buyer of a call option.
C) position diagram for the buyer of a put option.
D) profit diagram for the buyer of a put option.
Correct Answer:

Verified
Correct Answer:
Verified
Related Questions
Q3: Call options can have a positive value
Q29: Define the term call option.
Q40: Buying a call option, investing the present
Q43: For European options, the value of a
Q56: Figure 2 depicts the: <img src="https://d2lvgg3v3hfg70.cloudfront.net/TB1768/.jpg" alt="Figure
Q58: The value of a put option at
Q62: Explain the difference between a European option
Q64: If the stock price follows a random
Q67: Define the term option.
Q75: The value of a put option is