Multiple Choice
Figure 5-12 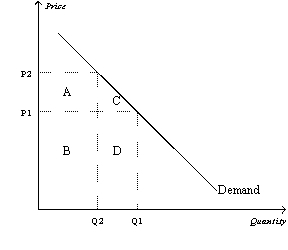
-Refer to Figure 5-12. Total revenue when the price is P1 is represented by the area(s)
A) B + D.
B) A + B.
C) C + D.
D) D.
Correct Answer:

Verified
Correct Answer:
Verified
Q12: If we observe that when the price
Q79: Total revenue<br>A)always increases as price increases.<br>B)increases as
Q94: Assume that a 4 percent increase in
Q96: Figure 5-4 <img src="https://d2lvgg3v3hfg70.cloudfront.net/TB2297/.jpg" alt="Figure 5-4
Q106: Using the midpoint method, compute the elasticity
Q115: Table 5-2<br> <span class="ql-formula" data-value="\begin{array}
Q212: For a particular good,a 2 percent increase
Q287: When we move upward and to the
Q300: Suppose demand is perfectly inelastic,and the supply
Q495: Figure 5-18<br> <img src="https://d2lvgg3v3hfg70.cloudfront.net/TB2185/.jpg" alt="Figure 5-18