Multiple Choice
Figure 5-14
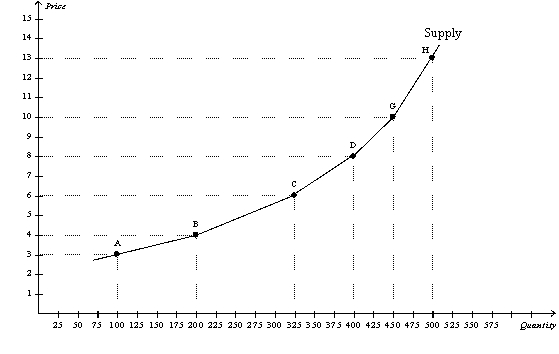
-Refer to Figure 5-14.Using the midpoint method,what is the price elasticity of supply between points B and C?
A) 1.67
B) 1.19
C) 0.84
D) 0.61
Correct Answer:

Verified
Correct Answer:
Verified
Related Questions
Q10: At a price of $1.00,a local coffee
Q12: Necessities such as food and clothing tend
Q30: On a certain supply curve,one point is
Q97: Price elasticity of supply measures how much
Q130: Figure 5-6<br> <img src="https://d2lvgg3v3hfg70.cloudfront.net/TB2185/.jpg" alt="Figure 5-6
Q132: Scenario 5-3<br>Milk has an inelastic demand, and
Q198: Which of the following is likely to
Q206: For which of the following goods is
Q271: Figure 5-4 <img src="https://d2lvgg3v3hfg70.cloudfront.net/TB2297/.jpg" alt="Figure 5-4
Q287: When we move upward and to the