Multiple Choice
Figure 8-10 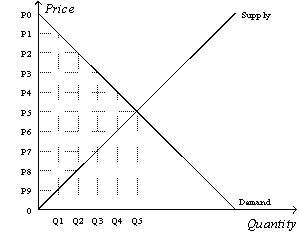
-Refer to Figure 8-10. Suppose the government imposes a tax that reduces the quantity sold in the market after the tax to Q2. With the tax, the consumer surplus is
A) (P0-P2) x Q2.
B) x (P0-P2) x Q2.
C) (P0-P5) x Q5.
D) x (P0-P5) x Q5.
Correct Answer:

Verified
Correct Answer:
Verified
Q60: Figure 8-19. The figure represents the relationship
Q82: Figure 8-6<br>The vertical distance between points A
Q119: When a tax is placed on the
Q132: Figure 8-14<br> <img src="https://d2lvgg3v3hfg70.cloudfront.net/TB2185/.jpg" alt="Figure 8-14
Q163: Figure 8-4<br>The vertical distance between points A
Q202: The demand for beer is more elastic
Q210: Figure 8-6<br>The vertical distance between points A
Q218: Figure 8-8<br>Suppose the government imposes a $10
Q229: When a tax is placed on a
Q235: Figure 8-2<br>The vertical distance between points A