Multiple Choice
Figure 8-18
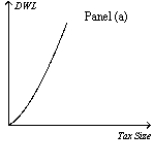
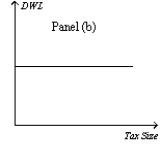
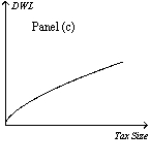
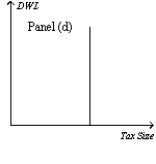
-Refer to Figure 8-18.Which graph correctly illustrates the relationship between the size of a tax and the size of the deadweight loss associated with the tax?
A) Panel (a)
B) Panel (b)
C) Panel (c)
D) Panel (d)
Correct Answer:

Verified
Correct Answer:
Verified
Q2: Economists generally agree that the most important
Q18: Figure 8-2<br>The vertical distance between points A
Q40: For the purpose of analyzing the gains
Q47: When a tax is imposed on a
Q70: Figure 8-5<br>Suppose that the government imposes a
Q140: Figure 8-10 <img src="https://d2lvgg3v3hfg70.cloudfront.net/TB2297/.jpg" alt="Figure 8-10
Q159: The benefit to buyers of participating in
Q160: The deadweight loss of a tax rises
Q185: Figure 8-3<br>The vertical distance between points A
Q204: Figure 8-5<br>Suppose that the government imposes a