Multiple Choice
Figure 8-19. The figure represents the relationship between the size of a tax and the tax revenue raised by that tax.
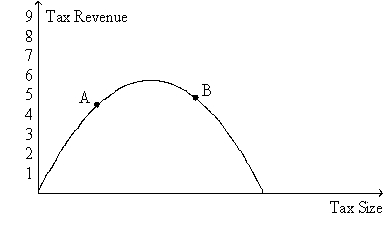
-Refer to Figure 8-19.The curve that is shown on the figure is called the
A) deadweight-loss curve.
B) tax-incidence curve.
C) Laffer curve.
D) Lorenz curve.
Correct Answer:

Verified
Correct Answer:
Verified
Q6: When a tax is imposed on the
Q9: Suppose a tax of $1 per unit
Q36: The amount of deadweight loss that results
Q37: Figure 8-3<br>The vertical distance between points A
Q44: Illustrate on three demand-and-supply graphs how the
Q125: A tax of $0.25 is imposed on
Q172: Diana is a personal trainer whose client
Q173: Figure 8-6<br>The vertical distance between points A
Q207: Figure 8-1 <img src="https://d2lvgg3v3hfg70.cloudfront.net/TB2297/.jpg" alt="Figure 8-1
Q221: Figure 8-9<br>The vertical distance between points A