Multiple Choice
Figure 8-19. The figure represents the relationship between the size of a tax and the tax revenue raised by that tax.
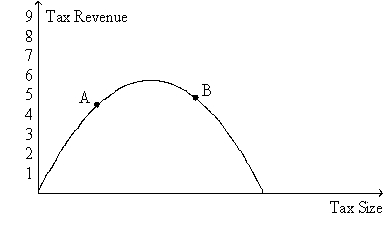
-Refer to Figure 8-19.If the economy is at point A on the curve,then a small increase in the tax rate will
A) increase the deadweight loss of the tax and increase tax revenue.
B) increase the deadweight loss of the tax and decrease tax revenue.
C) decrease the deadweight loss of the tax and increase tax revenue.
D) decrease the deadweight loss of the tax and decrease tax revenue.
Correct Answer:

Verified
Correct Answer:
Verified
Q12: Economists disagree on whether labor taxes cause
Q38: Figure 8-3<br>The vertical distance between points A
Q59: Suppose a tax of $0.10 per unit
Q121: For a good that is taxed, the
Q153: Figure 8-8<br>Suppose the government imposes a $10
Q162: The larger the deadweight loss from taxation,
Q165: The most important tax in the U.S.
Q291: Figure 8-10<br> <img src="https://d2lvgg3v3hfg70.cloudfront.net/TB2185/.jpg" alt="Figure 8-10
Q293: Figure 8-12<br> <img src="https://d2lvgg3v3hfg70.cloudfront.net/TB2185/.jpg" alt="Figure 8-12
Q298: Figure 8-16<br> <img src="https://d2lvgg3v3hfg70.cloudfront.net/TB2185/.jpg" alt="Figure 8-16