Multiple Choice
Figure 8-19. The figure represents the relationship between the size of a tax and the tax revenue raised by that tax.
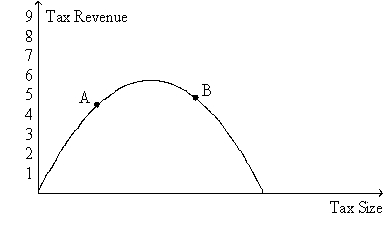
-Refer to Figure 8-19.If the economy is at point B on the curve,then an increase in the tax rate will
A) increase the deadweight loss of the tax and increase tax revenue.
B) increase the deadweight loss of the tax and decrease tax revenue.
C) decrease the deadweight loss of the tax and increase tax revenue.
D) decrease the deadweight loss of the tax and decrease tax revenue.
Correct Answer:

Verified
Correct Answer:
Verified
Q46: When the price of a good is
Q54: The benefit to sellers of participating in
Q60: Deadweight loss measures the loss<br>A)in a market
Q106: Tax revenue equals the size of the
Q188: Figure 8-9<br>The vertical distance between points A
Q216: In a recent research paper published by
Q219: Figure 8-20. The figure represents the relationship
Q221: Suppose Ashley needs a dog sitter so
Q222: For good X,the supply curve is the
Q244: Total surplus with a tax is equal