Multiple Choice
Figure 8-19. The figure represents the relationship between the size of a tax and the tax revenue raised by that tax.
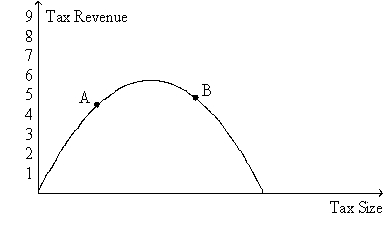
-Refer to Figure 8-19.If the economy is at point B on the curve,then a small decrease in the tax rate will
A) increase the deadweight loss of the tax and increase tax revenue.
B) increase the deadweight loss of the tax and decrease tax revenue.
C) decrease the deadweight loss of the tax and increase tax revenue.
D) decrease the deadweight loss of the tax and decrease tax revenue.
Correct Answer:

Verified
Correct Answer:
Verified
Q10: Figure 8-9<br>The vertical distance between points A
Q39: Which of the following statements is true
Q46: When the price of a good is
Q52: As more people become self-employed,which allows them
Q76: A tax on insulin is likely to
Q106: Tax revenue equals the size of the
Q188: Figure 8-9<br>The vertical distance between points A
Q209: Figure 8-17<br>The vertical distance between points A
Q216: In a recent research paper published by
Q236: The benefit that government receives from a