Essay
Use the following graph shown to fill in the table that follows. 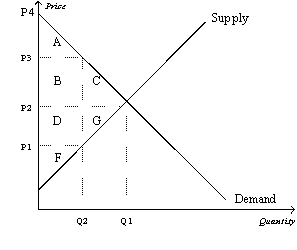

Correct Answer:

Verified
Correct Answer:
Verified
Related Questions
Q7: Suppose that policymakers are considering placing a
Q32: Concerning the labor market and taxes on
Q43: Which of the following statements correctly describes
Q69: When demand is relatively elastic, the deadweight
Q74: Figure 8-11 <img src="https://d2lvgg3v3hfg70.cloudfront.net/TB2297/.jpg" alt="Figure 8-11
Q122: When a tax is levied on a
Q125: A tax of $0.25 is imposed on
Q138: The Social Security tax, and to a
Q147: Figure 8-12<br> <img src="https://d2lvgg3v3hfg70.cloudfront.net/TB2185/.jpg" alt="Figure 8-12
Q320: Figure 8-10 <img src="https://d2lvgg3v3hfg70.cloudfront.net/TB4800/.jpg" alt="Figure 8-10