Multiple Choice
Figure 24-3. 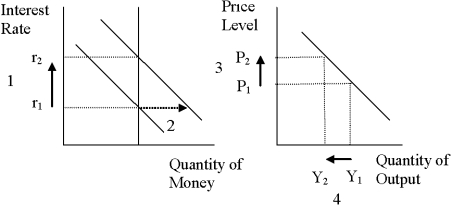
-Refer to Figure 24-3.What quantity is represented by the vertical line on the left-hand graph?
A) the supply of money
B) the demand for money
C) the rate of inflation
D) the quantity of bonds that was most recently sold or purchased by the Federal Reserve
Correct Answer:

Verified
Correct Answer:
Verified
Q25: Which of the following shifts aggregate demand
Q36: When the Fed lowers the growth rate
Q67: People will want to hold less money
Q71: There is an increase in government expenditures
Q78: Which of the following statements is correct
Q85: Supply-side economists believe that a reduction in
Q91: To reduce the effects of crowding out
Q99: In 2009 President Obama and Congress increased
Q152: In a certain economy, when income is
Q180: Figure 24-2.On the left-hand graph,MS represents the