Multiple Choice
Exhibit 19.1 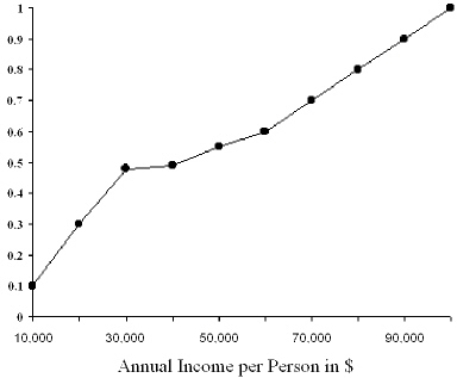 Refer to Exhibit 19.1.The figure above is an example of a
A) cumulative distribution function.
B) frequency polygon.
C) histogram.
D) one-way tabulation of annual income per person.
E) midpoint chart.
Correct Answer:

Verified
Correct Answer:
Verified
Q22: The FactFinder Research firm conducted a survey
Q33: Which of the following statements is FALSE?
Q33: A sampling procedure is statistically more efficient
Q34: Which of the following is TRUE?<br>A)A frequency
Q35: Exhibit 19.1 <img src="https://d2lvgg3v3hfg70.cloudfront.net/TB3273/.jpg" alt="Exhibit 19.1
Q38: An analyst is interested in testing the
Q40: Type I error<br>A)occurs when a true null
Q47: In using percentages for reporting results it
Q65: In the following data set, what is
Q68: The_is a statistical test to determine whether