Multiple Choice
You are given the following data for taillight assemblies: 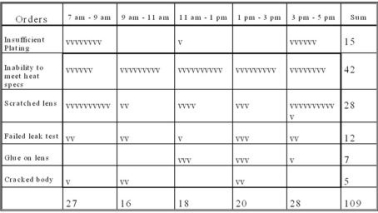 Management has decided that they must do something with the inability of the taillight assemblies to pass the quality specifications.Yet currently they do not know what areas they should look at.To help management in dealing with this issue, which of the following quality control tools would be most appropriate?
A) Histogram
B) Scatterplots
C) Cause-and-effect diagrams
D) Plan-Do-Check-Act
Correct Answer:

Verified
Correct Answer:
Verified
Q1: Which of the following categories of causes
Q5: Which of the following tools is most
Q8: You have been given the following sample
Q11: Sample means and ranges were obtained for
Q12: Forty samples of 100 are taken, with
Q13: Which of the following conclusions does the
Q13: Which of the following conclusions does the
Q27: Hugging in a control chart usually indicates:<br>A)The
Q31: Which of the following quality improvement tools
Q34: The width of a histogram showing a