Multiple Choice
Fifteen samples of size 10 are taken from a stable process.The average of the sample means is 32.8, and the average range of the samples is 1.5.What is the upper control limit for the R chart? Use the information contained in the attached chart. 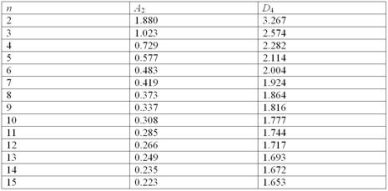
A) 1.777
B) 1.653
C) 2.666
D) 2.480
Correct Answer:

Verified
Correct Answer:
Verified
Q3: Under what conditions would we be required
Q10: The specifications for the diameter of a
Q18: A firm has an existing process that
Q20: The two types of data involved in
Q25: The Taguchi methods link process design to:<br>A)Customer
Q27: You are given the following data for
Q30: The specifications for the diameter of a
Q32: Sample means and ranges were obtained for
Q34: We are experiencing a problem where a
Q35: The objective of statistical process control (SPC)is