Multiple Choice
Use the information contained in the attached chart to determine your answer. Twenty samples of size 8 were taken from a stable process.From past studies of the process, you know that the overall mean is 42.5 and that the average of the samples range is 2.0.What is the upper control limit for the x-bar chart?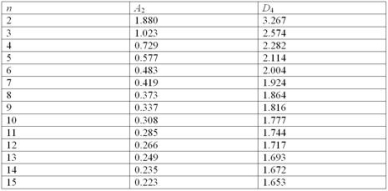
A) 43.25
B) 44.50
C) 46.22
D) 48.50
Correct Answer:

Verified
Correct Answer:
Verified
Q4: Which of the following types of control
Q9: A packaging plant is running a filling
Q10: The specifications for the diameter of a
Q16: Which of the following conclusions does the
Q21: Zanda Corp.has determined that it has too
Q23: You are given the following data for
Q25: The Taguchi methods link process design to:<br>A)Customer
Q27: Hugging in a control chart usually indicates:<br>A)The
Q32: "Pass/ fail" and "go/no go" are both
Q37: You are involved in the implementation of