Multiple Choice
The figure shown below represents a control chart determined from attribute data.Given this chart and the plotted observations,the most appropriate action would be 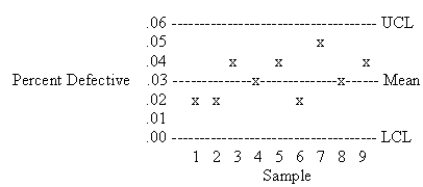
A) take immediate action to identify potential causes of the variation.
B) decrease the confidence interval for the control chart.
C) do nothing because the process appears to be operating in control.
D) increase the confidence interval for the control chart.
Correct Answer:

Verified
Correct Answer:
Verified
Q40: Surveys indicate that p charts are used
Q41: Which of the following is the best
Q42: Which of the following statements is NOT
Q43: A Pareto diagram<br>A) shows causes and effects
Q44: Name the seven tools of quality control
Q45: The ability of the process to meet,or
Q46: Which of the following is the best
Q47: Range charts are used to evaluate<br>A) the
Q48: A brewer bottles beer labeled "net weight
Q50: Which of the following statements about process