Multiple Choice
The downward-sloping line in the diagram below shows the combinations of health care and education expenditures that the government can afford with a given amount of tax revenue. 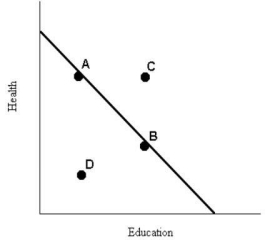 FIGURE 1-6
-Refer to Figure 1-6.The levels of health and education expenditures at point C
A) are less than at point D.
B) are equal to those of point A and point B.
C) are more cost-effective than those at points A,B,and D.
D) could be achieved if the prices of health and/or education increased.
E) are not attainable with the government's current budget.
Correct Answer:

Verified
Correct Answer:
Verified
Q5: During economic recessions,the opportunity cost of going
Q41: Many economies in central and Eastern Europe,including
Q61: Which of the following best describes the
Q71: Suppose Andrea has a job that pays
Q72: With a budget of $200 million,the government
Q73: Income redistribution in a mixed economy<br>A)is supported
Q80: Madeleine allows herself $100 per month for
Q81: Consider the following list: a worker with
Q81: The table below illustrates that,in one day,Tristan
Q87: Which of the following statements provides the