Multiple Choice
Figure 1-7 shows the production possibilities boundary for an economy that produces two goods - cotton and bananas. 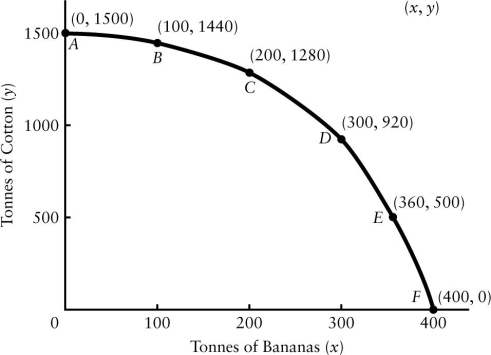 FIGURE 1-7
-Refer to Figure 1-7.A production possibilities boundary is shown for an economy that produces two goods - cotton and bananas,both measured in tonnes produced per year.Suppose this economy is currently producing 1280 tonnes of cotton and 200 tonnes of bananas.What is the opportunity cost of increasing production of bananas by 100 tonnes?
A) 100 tonnes of cotton
B) 360 tonnes of cotton
C) 360 tonnes of bananas
D) 920 tonnes of cotton
E) there is no opportunity cost
Correct Answer:

Verified
Correct Answer:
Verified
Q15: Because resources are scarce,individuals are required to<br>A)make
Q31: Which of the following statements about specialization
Q54: The world price of oil fell in
Q114: With a budget of $500 000,a school
Q115: Suppose you own a courier service and
Q116: With a budget of $500 000,a school
Q121: Suppose there are only two goods produced
Q130: In a modern mixed economy the government
Q134: Which of the following statements best describes
Q136: The famous economist who first described the