Multiple Choice
The table below shows hypothetical data for volumes of e-books and hardcover books sold over a 3-year period in a particular city.
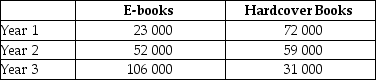 TABLE 2-3
-Refer to Table 2-3.Suppose we choose Year 1 as the base year and construct a series of index numbers with which to analyze sales data.The index numbers for volumes of hardcover books sold (starting with Year 1) is
A) 431; 819; 100.
B) 43.1; 81.9; 100.
C) 100; 81.9; 43.1.
D) 100; 0.819; 0.431.
E) 0.431; 0.819; 100.
Correct Answer:

Verified
Correct Answer:
Verified
Q43: Choose the answer that best explains why
Q51: Consider the functional relationship between two variables,X
Q71: According to the Bank of Canada's website,Canada's
Q73: Suppose economists at the World Bank develop
Q74: Figure 2-5 shows monthly average (per unit)production
Q75: Let 1 stand for "any given period"
Q79: On a coordinate graph with y on
Q90: For a given year,an index number of
Q114: Suppose we observe that consumption of electricity
Q123: An economic theory requires,among other things,<br>A)a set