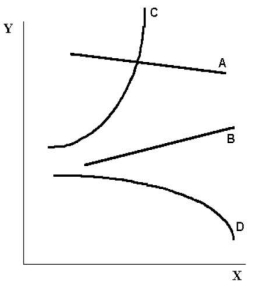
menu-iconExamlexExamLexServices

Discover

Ask a Question
  1. All Topics
  2. Topic
    Business
  3. Study Set
    Economics Study Set 1
  4. Exam
    Exam 2: Economic Theories,Data,and Graphs
  5. Question
    FIGURE 2-2 -Refer to Figure 2-2.The Slope of Curve a Is
Solved

FIGURE 2-2 -Refer to Figure 2-2.The Slope of Curve a Is

Question 35

Question 35

Multiple Choice

  FIGURE 2-2 -Refer to Figure 2-2.The slope of curve A is A) positive and constant. B) negative and constant. C) positive and changing. D) negative and changing. E) undefined. FIGURE 2-2
-Refer to Figure 2-2.The slope of curve A is


A) positive and constant.
B) negative and constant.
C) positive and changing.
D) negative and changing.
E) undefined.

Correct Answer:

verifed

Verified

Unlock this answer now
Get Access to more Verified Answers free of charge

Related Questions

Q31: A theory<br>A)enables one to predict the future

Q32: Of the following,which is the most important

Q34: <img src="https://d2lvgg3v3hfg70.cloudfront.net/TB5441/.jpg" alt=" FIGURE 2-4 -Refer

Q36: As a science,economics is disadvantaged in that<br>A)it

Q37: What is the best way to display

Q38: The table below shows the approximate value

Q39: On a coordinate graph with y on

Q40: The table below shows hypothetical tuition costs

Q107: Choose the statement that best characterizes an

Q139: On a coordinate graph with y on

Examlex

ExamLex

About UsContact UsPerks CenterHomeschoolingTest Prep

Work With Us

Campus RepresentativeInfluencers

Links

FaqPricingChrome Extension

Download The App

Get App StoreGet Google Play

Policies

Privacy PolicyTerms of ServiceHonor CodeCommunity Guidelines

Scan To Download

qr-code

Copyright © (2025) ExamLex LLC.

Privacy PolicyTerms Of ServiceHonor CodeCommunity Guidelines