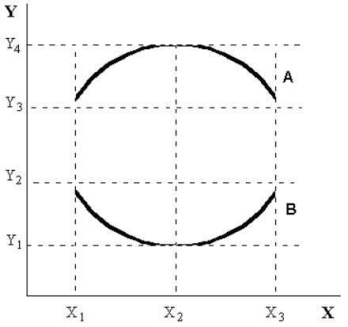
menu-iconExamlexExamLexServices

Discover

Ask a Question
  1. All Topics
  2. Topic
    Business
  3. Study Set
    Economics Study Set 1
  4. Exam
    Exam 2: Economic Theories,Data,and Graphs
  5. Question
    FIGURE 2-3 -Refer to Figure 2-3.The Slope of Curve a Is
Solved

FIGURE 2-3 -Refer to Figure 2-3.The Slope of Curve a Is

Question 89

Question 89

Multiple Choice

  FIGURE 2-3 -Refer to Figure 2-3.The slope of curve A is A) zero. B) negative and variable. C) positive and variable. D) positive from X<sub>1</sub> to X<sub>2</sub> and negative from X<sub>2</sub> to X<sub>3</sub>. E) negative from X<sub>1</sub> to X<sub>2</sub> and positive from X<sub>2 </sub>to X<sub>3</sub>. FIGURE 2-3
-Refer to Figure 2-3.The slope of curve A is


A) zero.
B) negative and variable.
C) positive and variable.
D) positive from X1 to X2 and negative from X2 to X3.
E) negative from X1 to X2 and positive from X2 to X3.

Correct Answer:

verifed

Verified

Unlock this answer now
Get Access to more Verified Answers free of charge

Related Questions

Q52: In order to test a theory,one must<br>A)develop

Q81: The slope of a straight line is

Q84: The table below shows hypothetical data for

Q87: When using statistics in economics,the possibility of

Q88: Suppose economists at the Department of Finance

Q90: The table below shows hypothetical tuition costs

Q92: <img src="https://d2lvgg3v3hfg70.cloudfront.net/TB5441/.jpg" alt=" FIGURE 2-2 -Refer

Q94: When an increase in one variable is

Q141: Suppose a theory predicts that lowering tuition

Q142: Which is the best description of a

Examlex

ExamLex

About UsContact UsPerks CenterHomeschoolingTest Prep

Work With Us

Campus RepresentativeInfluencers

Links

FaqPricingChrome Extension

Download The App

Get App StoreGet Google Play

Policies

Privacy PolicyTerms of ServiceHonor CodeCommunity Guidelines

Scan To Download

qr-code

Copyright © (2025) ExamLex LLC.

Privacy PolicyTerms Of ServiceHonor CodeCommunity Guidelines