Multiple Choice
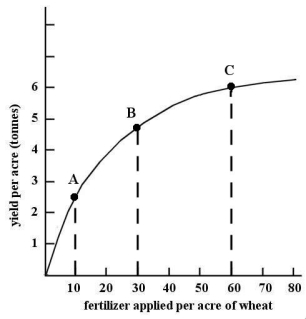 FIGURE 2-4
-Refer to Figure 2-4.This non-linear function shows that over the range shown,
A) as more fertilizer is applied,the marginal response in yield is increasing
B) as more fertilizer is applied,the marginal change in yield is diminishing.
C) as the yield per acre increases,the amount of fertilizer required per acre is diminishing.
D) as the yield per acre increases,the amount of fertilizer required per acre is increasing.
E) as more fertilizer is applied,the total yield per acre is diminishing.
Correct Answer:

Verified
Correct Answer:
Verified
Q29: When studying economic data,index numbers are especially
Q32: Economics is scientific because<br>A)economists routinely conduct controlled
Q83: The statement "Y is a function of
Q128: When studying economic data,and when comparing the
Q131: The table below shows hypothetical data for
Q133: Data collected repeatedly over successive periods of
Q134: <img src="https://d2lvgg3v3hfg70.cloudfront.net/TB5441/.jpg" alt=" FIGURE 2-1 -Refer
Q138: The table below shows hypothetical data for
Q139: The table below shows hypothetical prices for
Q140: The table below shows hypothetical data for