Multiple Choice
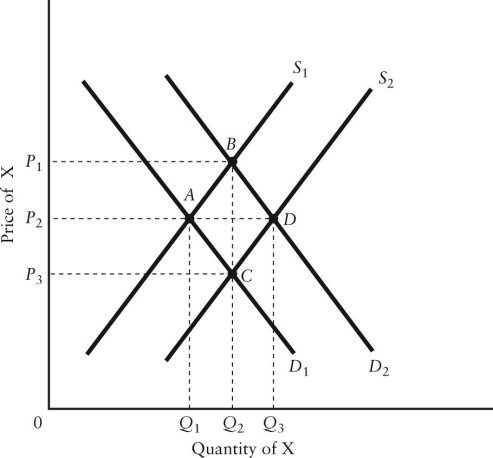 FIGURE 3-6
-Refer to Figure 3-6.A shift in the supply curve from S2 to S1 might be caused by
A) a rise in the costs of producing good X.
B) a decrease in the price of X.
C) a decrease in demand for X.
D) an improvement in the technology of producing good X.
E) additional suppliers entering the industry.
Correct Answer:

Verified
Correct Answer:
Verified
Q32: <img src="https://d2lvgg3v3hfg70.cloudfront.net/TB5441/.jpg" alt=" FIGURE 3-4 -Refer
Q34: <img src="https://d2lvgg3v3hfg70.cloudfront.net/TB5441/.jpg" alt=" FIGURE 3-3 -Refer
Q35: The price of one good divided by
Q37: The supply and demand schedules for dozens
Q40: A demand curve is a representation of
Q41: The demand and supply schedules for a
Q72: Given a positively sloped supply curve,when market
Q96: An equilibrium price can be described as<br>A)the
Q140: A rightward shift in the supply curve
Q144: If the legal beer-drinking age is raised