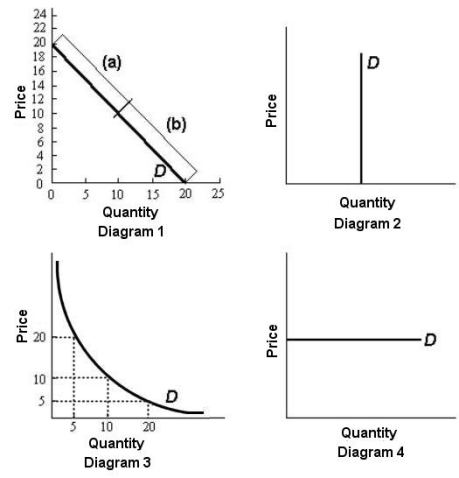
menu-iconExamlexExamLexServices

Discover

Ask a Question
  1. All Topics
  2. Topic
    Business
  3. Study Set
    Economics Study Set 1
  4. Exam
    Exam 4: Elasticity
  5. Question
    FIGURE 4-2 -Refer to Figure 4-2.In Diagram 3,the Elasticity of Demand Between
Solved

FIGURE 4-2 -Refer to Figure 4-2.In Diagram 3,the Elasticity of Demand Between

Question 103

Question 103

Multiple Choice

  FIGURE 4-2 -Refer to Figure 4-2.In diagram 3,the elasticity of demand between prices $10 and $20 is A) 0. B) less than 1. C) exactly 1. D) greater than 1. E) infinity. FIGURE 4-2
-Refer to Figure 4-2.In diagram 3,the elasticity of demand between prices $10 and $20 is


A) 0.
B) less than 1.
C) exactly 1.
D) greater than 1.
E) infinity.

Correct Answer:

verifed

Verified

Unlock this answer now
Get Access to more Verified Answers free of charge

Related Questions

Q98: Suppose Statistics Canada reports that total income

Q99: Suppose you are advising the government on

Q100: Consider an excise tax imposed on daily

Q101: The elasticity of supply for a given

Q102: Consider the following data for a hypothetical

Q104: Suppose that the quantity demanded of a

Q105: Rania is selling boxes of cookies door

Q106: Which of the following tends to be

Q107: The table below shows the demand schedule

Q108: If pizza and beer are complementary goods,we

Examlex

ExamLex

About UsContact UsPerks CenterHomeschoolingTest Prep

Work With Us

Campus RepresentativeInfluencers

Links

FaqPricingChrome Extension

Download The App

Get App StoreGet Google Play

Policies

Privacy PolicyTerms of ServiceHonor CodeCommunity Guidelines

Scan To Download

qr-code

Copyright © (2025) ExamLex LLC.

Privacy PolicyTerms Of ServiceHonor CodeCommunity Guidelines