Multiple Choice
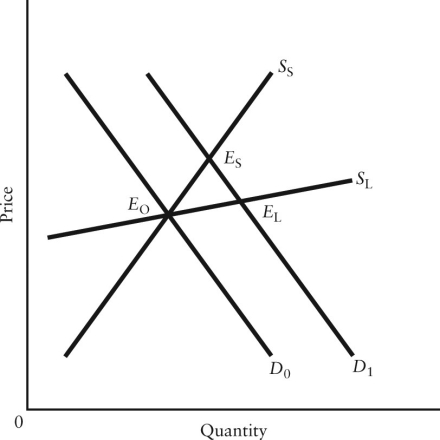 FIGURE 4-3
-Refer to Figure 4-3.The diagram shows a rightward shift in the demand curve for some good,and the short-run and long-run supply curves (SS and SL,respectively) .In the new short-run equilibrium after the increase in demand,producers' revenue
A) is unambiguously lower than in the long-run equilibrium at EL.
B) could be higher or lower than at E0,depending on the short-run elasticity of supply.
C) is unambiguously higher than at E0.
D) is unambiguously lower than at E0.
E) is unambiguously higher than at EL.
Correct Answer:

Verified
Correct Answer:
Verified
Q8: When national income falls,sales of vacation packages
Q9: Consider the following data for a hypothetical
Q10: The formula for the price elasticity of
Q11: Which of the following statements would you
Q12: With a downward-sloping straight-line demand curve,price elasticity
Q14: Suppose the current level of output of
Q15: Income elasticity of demand measures the extent
Q16: Suppose the price of take-out pizza has
Q17: If two goods,X and Y,have a negative
Q18: <img src="https://d2lvgg3v3hfg70.cloudfront.net/TB5441/.jpg" alt=" FIGURE 4-2 -Refer