Multiple Choice
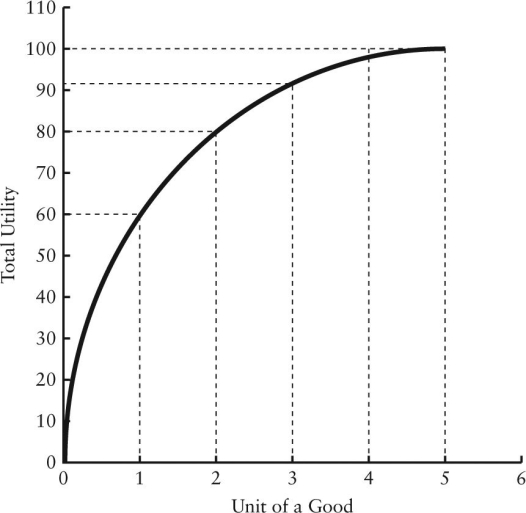 FIGURE 6-1
-Refer to Figure 6-1.The consumer's total utility is
A) increasing at an increasing rate.
B) increasing at a decreasing rate.
C) decreasing at an increasing rate.
D) decreasing at a decreasing rate.
E) constant.
Correct Answer:

Verified
Correct Answer:
Verified
Q54: If all consumers in an economy have
Q55: Given a particular market demand curve,consumer surplus
Q56: Assume you are consuming two goods,X and
Q57: <img src="https://d2lvgg3v3hfg70.cloudfront.net/TB5441/.jpg" alt=" FIGURE 6-2 -Refer
Q58: <img src="https://d2lvgg3v3hfg70.cloudfront.net/TB5441/.jpg" alt=" FIGURE 6-2 -Refer
Q60: <img src="https://d2lvgg3v3hfg70.cloudfront.net/TB5441/.jpg" alt=" FIGURE 6-1 -Refer
Q61: Consider the substitution and income effects of
Q62: Suppose there are only two goods,A and
Q63: In which of the following situations will
Q64: Marginal utility analysis predicts a downward-sloping demand