Multiple Choice
Diagrams A,B,and C show 3 individual consumers' demand curves for cement.Consumers A,B,and C constitute the entire monthly cement market in this region. 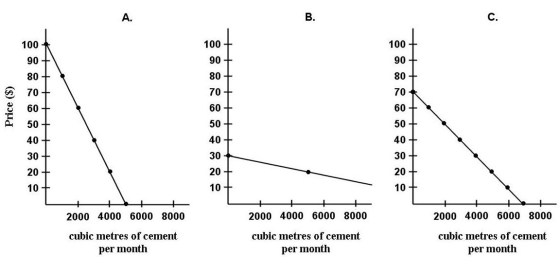 FIGURE 6-3
-Refer to Figure 6-3.On the regional market demand curve for cement (not shown) ,at which price level(s) is there a "kink" in the demand curve?
A) $10
B) $20 and $30
C) $30 and $70
D) $40 and $70
E) $80
Correct Answer:

Verified
Correct Answer:
Verified
Q108: If consumption of an extra unit of
Q109: Suppose a consumer can purchase only two
Q110: A parallel shift in the consumer's budget
Q111: If John consumes only two goods,A and
Q112: The figures below show Chris's consumption of
Q114: Sophie consumes two goods - paperback novels
Q115: The substitution effect of a price change
Q116: Economists use the term "marginal utility" to
Q117: A consumer maximizes his or her utility
Q118: An individual's consumer surplus from some product