Multiple Choice
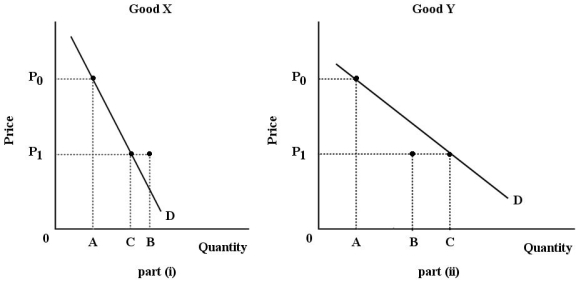 FIGURE 6-4
-Refer to Figure 6-4.For both goods,the price falls from P0 to P1.The substitution effect is illustrated by the change in quantity demanded from A to B; the income effect is illustrated by the change in quantity demanded from B to C.Good Y is certainly a(n) ________ good.
A) normal
B) inferior
C) luxury
D) necessity
E) Giffen
Correct Answer:

Verified
Correct Answer:
Verified
Q60: <img src="https://d2lvgg3v3hfg70.cloudfront.net/TB5441/.jpg" alt=" FIGURE 6-1 -Refer
Q61: Consider the substitution and income effects of
Q62: Suppose there are only two goods,A and
Q63: In which of the following situations will
Q64: Marginal utility analysis predicts a downward-sloping demand
Q66: Assume an individual with a downward-sloping demand
Q67: A basic hypothesis of marginal utility theory
Q68: The Smith family is allocating its monthly
Q69: In economics,the term "utility" is defined as
Q70: The marginal rate of substitution measures the