Multiple Choice
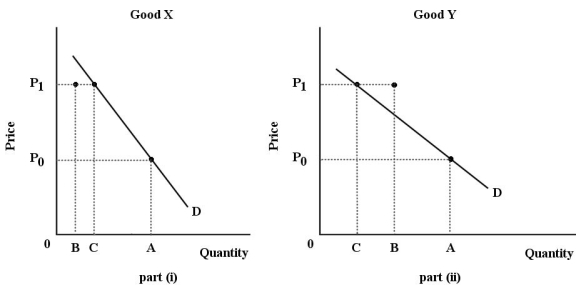 FIGURE 6-5
-Refer to Figure 6-5.For both goods,the price increases from P0 to P1.The substitution effect is illustrated by the change in quantity demanded from A to B; the income effect is illustrated by the change in quantity demanded from B to C.Good Y is certainly a(n) ________ good.
A) inferior
B) normal
C) luxury
D) necessity
E) Giffen
Correct Answer:

Verified
Correct Answer:
Verified
Q87: For your typical consumption levels of water
Q88: Consider the income and substitution effects of
Q89: The substitution effect of a price change<br>A)will
Q90: <img src="https://d2lvgg3v3hfg70.cloudfront.net/TB5441/.jpg" alt=" FIGURE 6-1 -Refer
Q91: <img src="https://d2lvgg3v3hfg70.cloudfront.net/TB5441/.jpg" alt=" FIGURE 6-9 -Refer
Q93: If the income effect of a price
Q94: The demand curve for a good with
Q95: The diagram below shows a set of
Q96: The table below shows the quantities of
Q97: Consider the pizza market,with a downward-sloping demand