Multiple Choice
The diagram below shows a set of budget lines facing a household. 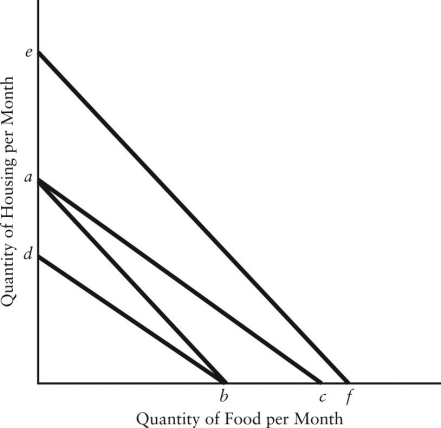 FIGURE 6-8
-Refer to Figure 6-8.The movement of the budget line from ab to ef could be caused by
A) a decrease in real income.
B) an increase in money income.
C) an equal percentage increase in the price of both food and housing.
D) a decrease in the price of either food or housing.
E) an increase in the price of either food or housing.
Correct Answer:

Verified
Correct Answer:
Verified
Q130: <img src="https://d2lvgg3v3hfg70.cloudfront.net/TB5441/.jpg" alt=" FIGURE 6-4 -Refer
Q131: <img src="https://d2lvgg3v3hfg70.cloudfront.net/TB5441/.jpg" alt=" FIGURE 6-9 -Refer
Q132: <img src="https://d2lvgg3v3hfg70.cloudfront.net/TB5441/.jpg" alt=" FIGURE 6-1 -Refer
Q133: The substitution effect is<br>A)the change in quantity
Q134: Given a particular consumer's indifference map,the further
Q135: Since there is a relatively plentiful supply
Q137: The table below shows the total value
Q138: <img src="https://d2lvgg3v3hfg70.cloudfront.net/TB5441/.jpg" alt=" FIGURE 6-2 -Refer
Q139: Bjorn is a student with a monthly
Q140: <img src="https://d2lvgg3v3hfg70.cloudfront.net/TB5441/.jpg" alt=" FIGURE 6-6 -Refer